+44 (0) 1223 755950
+1 832 327 7413
Flow cytometry is a method widely used for the separation, classification and quantification of cells. Samples are suspended in fluid, and are then focused via computerised mechanisms into a mono-cellular stream which is passed through a beam of laser light. Through the measurement of scattered light, cells can be categorised by size, and subsequently by cell type. Antibodies conjugated to both fluorescent dyes and fluorescent intercalating agents are often used to mark specific cell components; targets will display a fluorescent light emmision which is proportional to the total target presence in the cell. The staining procedure involves making single-cell suspensions from cell culture or tissue samples. The cells are then incubated in tubes or microtiter plates with or without fluorescently-labelled antibodies and analysed using a flow cytometer. Size analysis, in conjunction with counted fluorescent emission, enables to determination and characterisation of specific cellular subsets, even when the size of the cell is identical to other subset species. This provides a simultaneous multi-parameter analysis of single cells for the characterisation and definition of different cell types in heterogeneous cell populations.
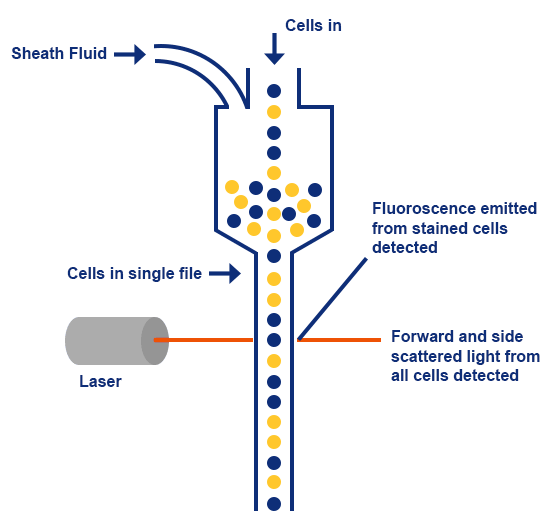 |
Flow Cytometry involves the measurement of scattered light and fluorescence, and it is dependent on dynamic fluidics to pass cell suspensions through the flow cytometer. When an individual cell suspension is run through the cytometer, sheath fluid is used to hydro-dynamically focus the cell suspension through a small nozzle. This allows the transport of cells through a laser light, one cell at a time. As cells pass through the laser beam, light scattering is detected; this is detected as forward scatter (FS), or side scatter (SS), which correlates to cell size and granularity respectively. As well as distinguishing cells based on differences in their size and granularity, fluorescence detectors that measure fluorescence emissions from positively stained samples can be used to separate cells based on protein expression.
Forward and side scattered light, and fluorescence from stained cells are split into defined wavelengths, which are then directed by a set of filters and mirrors within the flow cytometer. Fluorescent light is filtered so that each sensor, called photomultiplying tubes (PMTs), only detects fluorescent emission at a specific wavelength - for example, a PMT channel set-up for the detection of FITC (fluorescein isothiocyanate) will only detect light emitted from FITC, or fluorophores emitted at a wavelength of around 519 nm. The fluorophores only emit light when excited by a laser with the corresponding excitation wavelength. This can be used to detect fluorescently stained cells or particles individually.
Fluorophore-conjugated samples emit fluorescence that is detected and measured by specific PMTs. This emission is then converted to a voltage pulse, also known as an 'event'. As fluorescently labelled samples are passed through the laser beam, the intensity of voltage increases, producing a voltage pulse that is completed when labelled cells completely travel through the beam. This gives a final pulse height and pulse area, which can be measured by the flow cytometer.
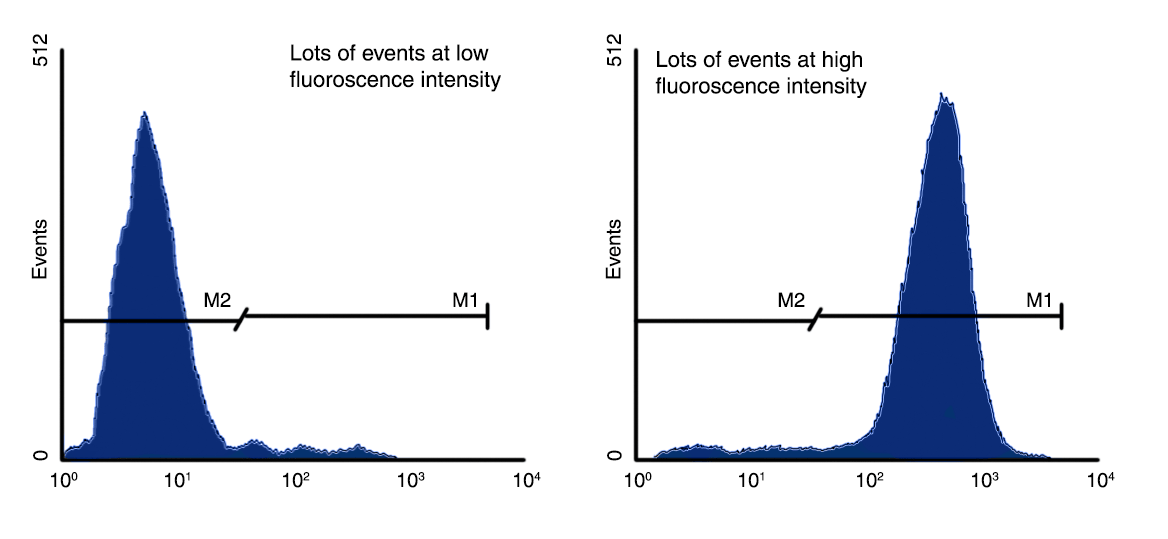 |
The voltage pulse area correlates directly to the fluorescence intensity of an event. As a result, these events can be assigned to channels based on pulse intensity (pulse area) whereby a higher fluorescence intensity results in the allocation of a higher channel number for an event. This can be used to assess cell populations that are positive and negative for a particular protein of interest. A negative result would be shown as a large number of events at low fluorescence intensities, whereas a positive result would be shown as a large number of events at high fluorescence intensities.
The results of flow cytometry are often displayed as a dot plot. A dot plot can be used to separate cells into different populations based on size (forward scatter), granularity (side scatter) and/or fluorescent labelling (fluorescent emission). This allows for the separation of different cell types into distinct clusters of cell types, such as monocytes and lymphocytes [left]. Furthermore, dot plots can be used to separate and analyse normal (viable) cells, from apoptotic cells and dead cells based on cell labelling with fluorophore-conjugated Annexin V (e.g. Annexin V-FITC) and a DNA stain such as propidium iodide (PI) [right].
 |
The ability of a given antibody or dye to resolve a positive signal from a negative signal often depends on which fluorophore is used. For example, a highly expressed antigen will usually be detected and resolved from the negative control with most fluorophores. However, an antigen expressed at lower levels may require a fluorophore with a higher intensity such as PE (R-PE) and APC in order to separate positive cells from unstained cells. A guideline for the intensity of various fluorophores is, from 'brightest' to 'dimmest', PE (R-PE), APC, AF647, FITC, CF-Blue and then AF488.
Another factor to be considered is the colour, as well as the maximum excitation and emission wavelengths of individual fluorophores. Each fluorophore has a particular emission and excitation fluorescence spectra, and therefore the wavelength(s) at which they emit light differ. As a result, multiple different fluorophore-conjugated antibodies against different proteins of interest can be used to sort cells into several different clusters.
See our interactive fluorescence spectra viewer here.
Fluorophore |
Colour |
Excitation Max (nm) |
Emission Max (nm) |
| AF350 | Blue | 346 | 442 |
| DyLight 405 | Violet | 400 | 421 |
| CF-Blue | Blue-violet | 408 | 450 |
| PerCP | Blue-cyan | 480 | 675 |
| DyLight 488 | Green | 493 | 512 |
| AF488 | Cyan-green | 495 | 520 |
| FITC (Fluorescin) | Green | 499 | 515 |
| Cy3 | Yellow-Green | 553 | 566 |
| TRITC | Orange | 552 | 576 |
| DyLight 549 | Yellow | 562 | 576 |
| PE (Phycoerythrin) | Orange-red | 565 | 575 |
| AF555 | Yellow-green | 555 | 567 |
| AF594 | Orange-red | 590 | 620 |
| Texas Red | Red | 593 | 612 |
| DyLight 594 | Orange | 593 | 618 |
| DyLight 633 | Red | 638 | 658 |
| Cy5 | Red | 649 | 666 |
| APC | Red | 651 | 660 |
| AF647 | Far-red | 651 | 665 |
| APC / Cyanine 7 | Far-red | 651 | 785 |
| DyLight 649 | Red | 654 | 673 |
| DyLight 680 | Far-red | 692 | 712 |
| DyLight 800 | Near-infrared | 777 | 794 |